Project Summary
Scientific/Technical
objectives and innovation
Project Workplan
Consortium
Results
Links
Project webgroup
(Restricted Access)

Rationale
Until recently continental monitoring stations have been avoided because of the large variability of the signals, caused by the proximity to the land-biosphere atmosphere exchange fluxes and the large, spatially highly concentrated fossil fuel emissions. Measurements in the free troposphere however, are a useful first step to characterize the fluxes at the continental scale (e.g. Eurasia vs. N. America) because they provide a constraint of the annual mean and seasonal distribution of atmospheric concentrations over the interior of the continents.
We will take advantage of the strong mixing in the lowermost 1 to 2 km of the atmosphere during day caused by cumulus convection. If the gases are measured at sufficient height above ground (ideally a few hundred meters), then a fairly homogeneous signal that integrates fluxes over a footprint on the order of a circle of 500 to 1000 km is obtained, see figure. Continuous measurements furthermore permit to optimise the signal to "noise" ratio of the measurements.
An investigation of the signal to "noise" in highly resolved models of atmospheric transport indicate that tall tower stations spaced at approximately 500 to 1000 km from one another are needed to obtain sufficient statistics for robust conclusions on carbon fluxes.
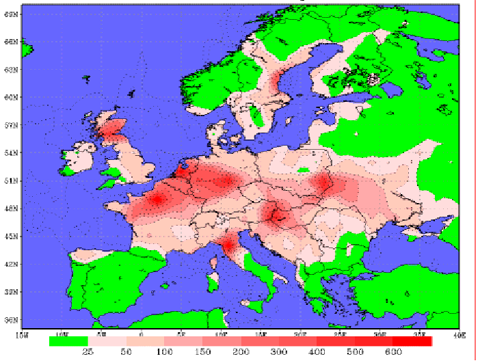
In this project we propose to make use of existing tall towers in The Netherlands (Cabauw), Germany (Ochsenkopf), Hungary (Hegyhatsal), Sweden (Norunda) and Siberia (Zotino). These towers will partly be complemented in order to measure more components than currently available. This task is performed in work package 2. We will also extend this network with four new tall towers in Great-Britain (Edinburgh), Italy (Florence), France (Orleans) and Poland (Bialowieza). This task is performed in work package 1.
ATM calculations were used to derive a network design that will provide us with the maximum coverage over Europe with the minimum number of tall tower stations. As can be seen from the figure, we will cover the largest part of the EU territory with only 8 tall tower stations.
Measurement support and quality assurance program
In order to use the time-series of concentration data of a set of spatially separated towers in atmospheric transport models to derive emissions, the concentrations should be precise and accurate, i.e. based on the same absolute accepted concentration scale using common high and low calibration standards. Although most partners will use different equipment for the measurements, we agree on a minimum precision and accuracy. The minimum desired precision is a compromise between the variability of the signal (dependent on location, source and sink strength in the region of the tower), errors in the transport models in which the data will be used, size of the hourly/daily/monthly concentration variation relative to the absolute concentration and instrumental limitations.
The instrumentation on the towers is designed to be operated automatically. However periodically attendance and maintenance is required. Most Gas Chromatograph systems for example have to be supplied with carrier gases (He, N2) and deionized water for the hydrogen generator once every two weeks. Also the collecting and renewal of sample bottles for the isotope grab samples has to be performed periodically. Large maintenance is required for most instruments every year.
Also the working standards have to replaced at fixed times, depending on the rate of use by the different instruments. Sensitive instruments like the ones used in this project also need periodical checking and adjusting on site.
In work package 3 these activities are supported. Firstly a detailed description per tower is produced of all the necessary actions to ensure the highest quality of the data and data coverage in time by means of a strict maintenance and calibration scheme. A yearly quality report of the measurements will be prepared within WP3.
Both inter- and intra- laboratory calibration of gas species are best achieved by a combination of two approaches:
- regular calibration of field gas analysers with a suite of high pressure gas cylinders containing known, accurately determined gas concentrations; and
- regular checks of the data derived from continuous field analysers against flask samples which are analysed in a central laboratory. A flask sample may be analysed by more than one laboratory, and gas cylinders can be initially calibrated by a laboratory accepted worldwide as maintaining a benchmark scale for the trace gas species of interest.
In work package 4 we will develop and sustain a data transmission facility from the towers to the laboratories and establish a central data base system for ready access for analysis of the data from all the participating laboratories. This allows permanent control of the measurement devices and thus fast reaction in case of irregularities or failure. Because the value of trace gas measurements hinges critically on the precision and accuracy of the measurements, measurement devices are in constant development and thus particularly sensitive to perturbations and their proper functioning needs therefore to be monitored regularly.
A first goal of work package 4 is to develop and sustain the necessary infrastructure to remotely monitor the tower stations with a virtual interface.
The second goal of work package 4 is to design and sustain a central database for the purpose of fast and uncomplicated analysis of the data. A relational database management system shall store all measured and derived data, continuous or flask measurements of gas concentrations, eddy fluxes, (micro-)meteorological data etc.
Dissemination
It is of particular importance to disseminate the results of CHIOTTO and put this results in perspective of the final goal of the Kyoto protocol efforts in Europe. To achieve the goal of increasing the visibility of the results and to build an interface with the European society, synthesis data will be assembled in the format of reports which will accessible through internet in the WEB page of the project. This work is performed through work package 7. In addition the description of the sites, the monitoring capabilities and the methodology used will be available on-line. A workshop will be organized to present the added value of the CHIOTTO monitoring network to the other international and regional programmes (i.e. GEMS, IGCO, TCO) and agencies interested in terrestrial carbon monitoring and policy institutions responsible of greenhouse gas inventories.
The rationale behind integrating the tall tower atmospheric stations and flux towers
To reduce the uncertainty associated with the fluxes derived by inverse modeling of the concentration measurements we will use direct measurements of the fluxes by eddy covariance. This part is performed in work package 6. Currently, the inverse modeling results are validated using occasional (1 or 2 times a year) profile measurements made by aircraft. With the establishment of the tall towers and the present available eddy covariance technique it is now possible to measure CO2 fluxes at a height where the measured flux represents an area varying from several km2 to several tens of km2 depending on atmospheric conditions. This will make it possible to validate the fluxes derived from inverse modeling throughout the year under different climatic conditions. The top-level measurement is used to obtain a representative flux measurement of an area as large as possible. The flux measurements at the level below the inversion layer are needed to ensure continuous flux measurements during periods with a low inversion height that occur under stable conditions (e.g. at night). Additional measurements of the flux above homogenous patches within the footprint of the tall towers will make it possible to scale down the flux measurements of the tall towers and thus increase the confidence in the interpretation of the large-scale flux. The objectives are
- To set up flux measurements to assess the Net Ecosystem Exchange at large scale (several km2).
- To quantify the contribution of specific land use types to the large-scale flux.
- To constrain the flux derived by inverse modeling from the concentration measurements.
Work package list
| WP number |
WP Title | Leader | Start month |
End month |
Deliverables |
|---|---|---|---|---|---|
| WP1 | New tall towers set-up | CEA | 1 | 18 | 1.1,1.2 |
| WP2 | Existing tall towers improvements and extensions | ECN | 1 | 12 | 2.1 |
| WP3 | Tall tower operation support and quality assurance | ECN | 1 | 36 | 3.1,3.2,3.3 |
| WP4 | Online transmission of tall tower data and central database | MPI | 1 | 36 | 4.1,4.2 |
| WP5 | Calibration setup and round-robins | MPI | 1 | 36 | 5.1,5.2,5.3 |
| WP6 | Accompanying flux tower operation | Alterra | 1 | 36 | 6.1,6.2,6.3 |
| WP7 | Data reporting to WDCGG and EU, data dissemination | UNITUS | 1 | 36 | 7.1,7.2,7.3 |
PROJECT COORDINATOR:
1- ECN Energy research Center of the Netherlands - Clean Fossil Fuels Dept - Air Quality group, NL
Contractors:
2- LSCE (CEA-DSM) Commissariat � l'Energie Atomique -Laboratoire des Sciences du Climat et de l'Environnement, F
3- MPI-BGC Max-Planck-Institut f�r Biogeochemie, D
4- ALTERRA Alterra Green World Research, NL
5- UEDIN University of Edinburgh-Institute of Ecology and Resource Management, UK
6- ELTE-TTK Eotvos Lorand University - Department of Meteorology HU
7- LSCE (CEA-CNRS) Laboratoire des Sciences du Climat et de l'Environnement, F
8 - UNITUS University of Tuscia - Dept. of Forest Environment and Resources, I
9 - LUPG University of Lund - Department of Physical Geography, S
Deliverables list
| Deliv. No. |
Deliverable title | Deliv. Date |
Nature | Dissem. Level |
|---|---|---|---|---|
| D1.1 | Installation of the new measurement stations at Orleans, Bialowieza, Edinburgh and Florence | 12 | Equipment | Restricted |
| D1.2 | Integration of the new stations into the network of the project | 18 | Methodology | Public |
| D2.1 | Installation of the additional methods at the existing stations | 12 | Equipment | Report |
| D3.1 | Report on the quality assurance requirements of the existing tower measurements | 3 | Report | Public |
| D3.2 | Report on the data quality and data coverage of the ongoing measurements | 12,24, 36 | Report | Public |
| D3.3 | Time-series of two (new) resp. three (existing) years of quality controlled measurement data of the concentrations of the most important greenhouse gases at the tall towers | 36 | Dataset | Public |
| D4.1 | Virtual interface design | 12 | Methodology | Public |
| D4.2 | Central database design | 15 | Methodology | Public |
| D5.1 | Operational system for preparing the working standards | 8 | Equipment | Restricted |
| D5.2 | Operational system for calibration of all the tall tower measurements | 12 | Equipment | Restricted |
| D5.3 | Report on the data quality and data inter-comparability | 12,24, 36 | Report | Public |
| D6.1 | Operational tall tower system to measure CO2 fluxes at two selected sites | 5 | Equipment | Report |
| D6.2 | Operational system to measure CO2 fluxes at one or two representative sites within the flux footprint of the tall towers | 5 | Equipment | Report |
| D6.3 | Time series of surface CO2 fluxes at an around the two selected sites | 12, 18, 24, 30, 36 | Dataset | Public |
| D7.1 | On line report of atmospheric concentration data (year 1) | 12,24, 36 | Report | Public |
| D7.2 | Web page with dissemination and structure of CHIOTTO | 12 | Report | Public |
Milestones list
| Milestone No. |
Milestone title | Milestone Date |
|---|---|---|
| MS1.1 | Four new tall towers fully equipped | 13 |
| MS1.2 | On-line greenhouse gas data from new towers | 18 |
| MS2.1 | Five existing towers fully equipped | 13 |
| MS3.1 | Quality assurance program for new and existing towers established | 3 |
| MS3.2 | Yearly overview on data quality and data coverage | 12,24,36 |
| MS4.1 | Automated data transfer and storage implemented | 15 |
| MS5.1 | Installation of the compression line for working standards | 6 |
| MS5.2 | Routine operation of flask sampling at the tall towers | 12 |
| MS5.3 | Yearly overview on data quality and intercomparibility | 12,24,36 |
| MS6.1 | operational flux station at high towers | 5 |
| MS6.2 | operational flux station at additional sites | 5 |
| MS6.3 | quality controlled flux data | 12,18,24, 30,36 |
| MS7.1 | Preparation and harmonization of data formats for subsequent reporting | 8 |
| MS7.2 | Release of WEB page | 12 |
| MS7.3 | Conference on CHIOTTO contribution to international and regional programmes | 24 |